SaaS Product (B2B)

Live Project & Prototype

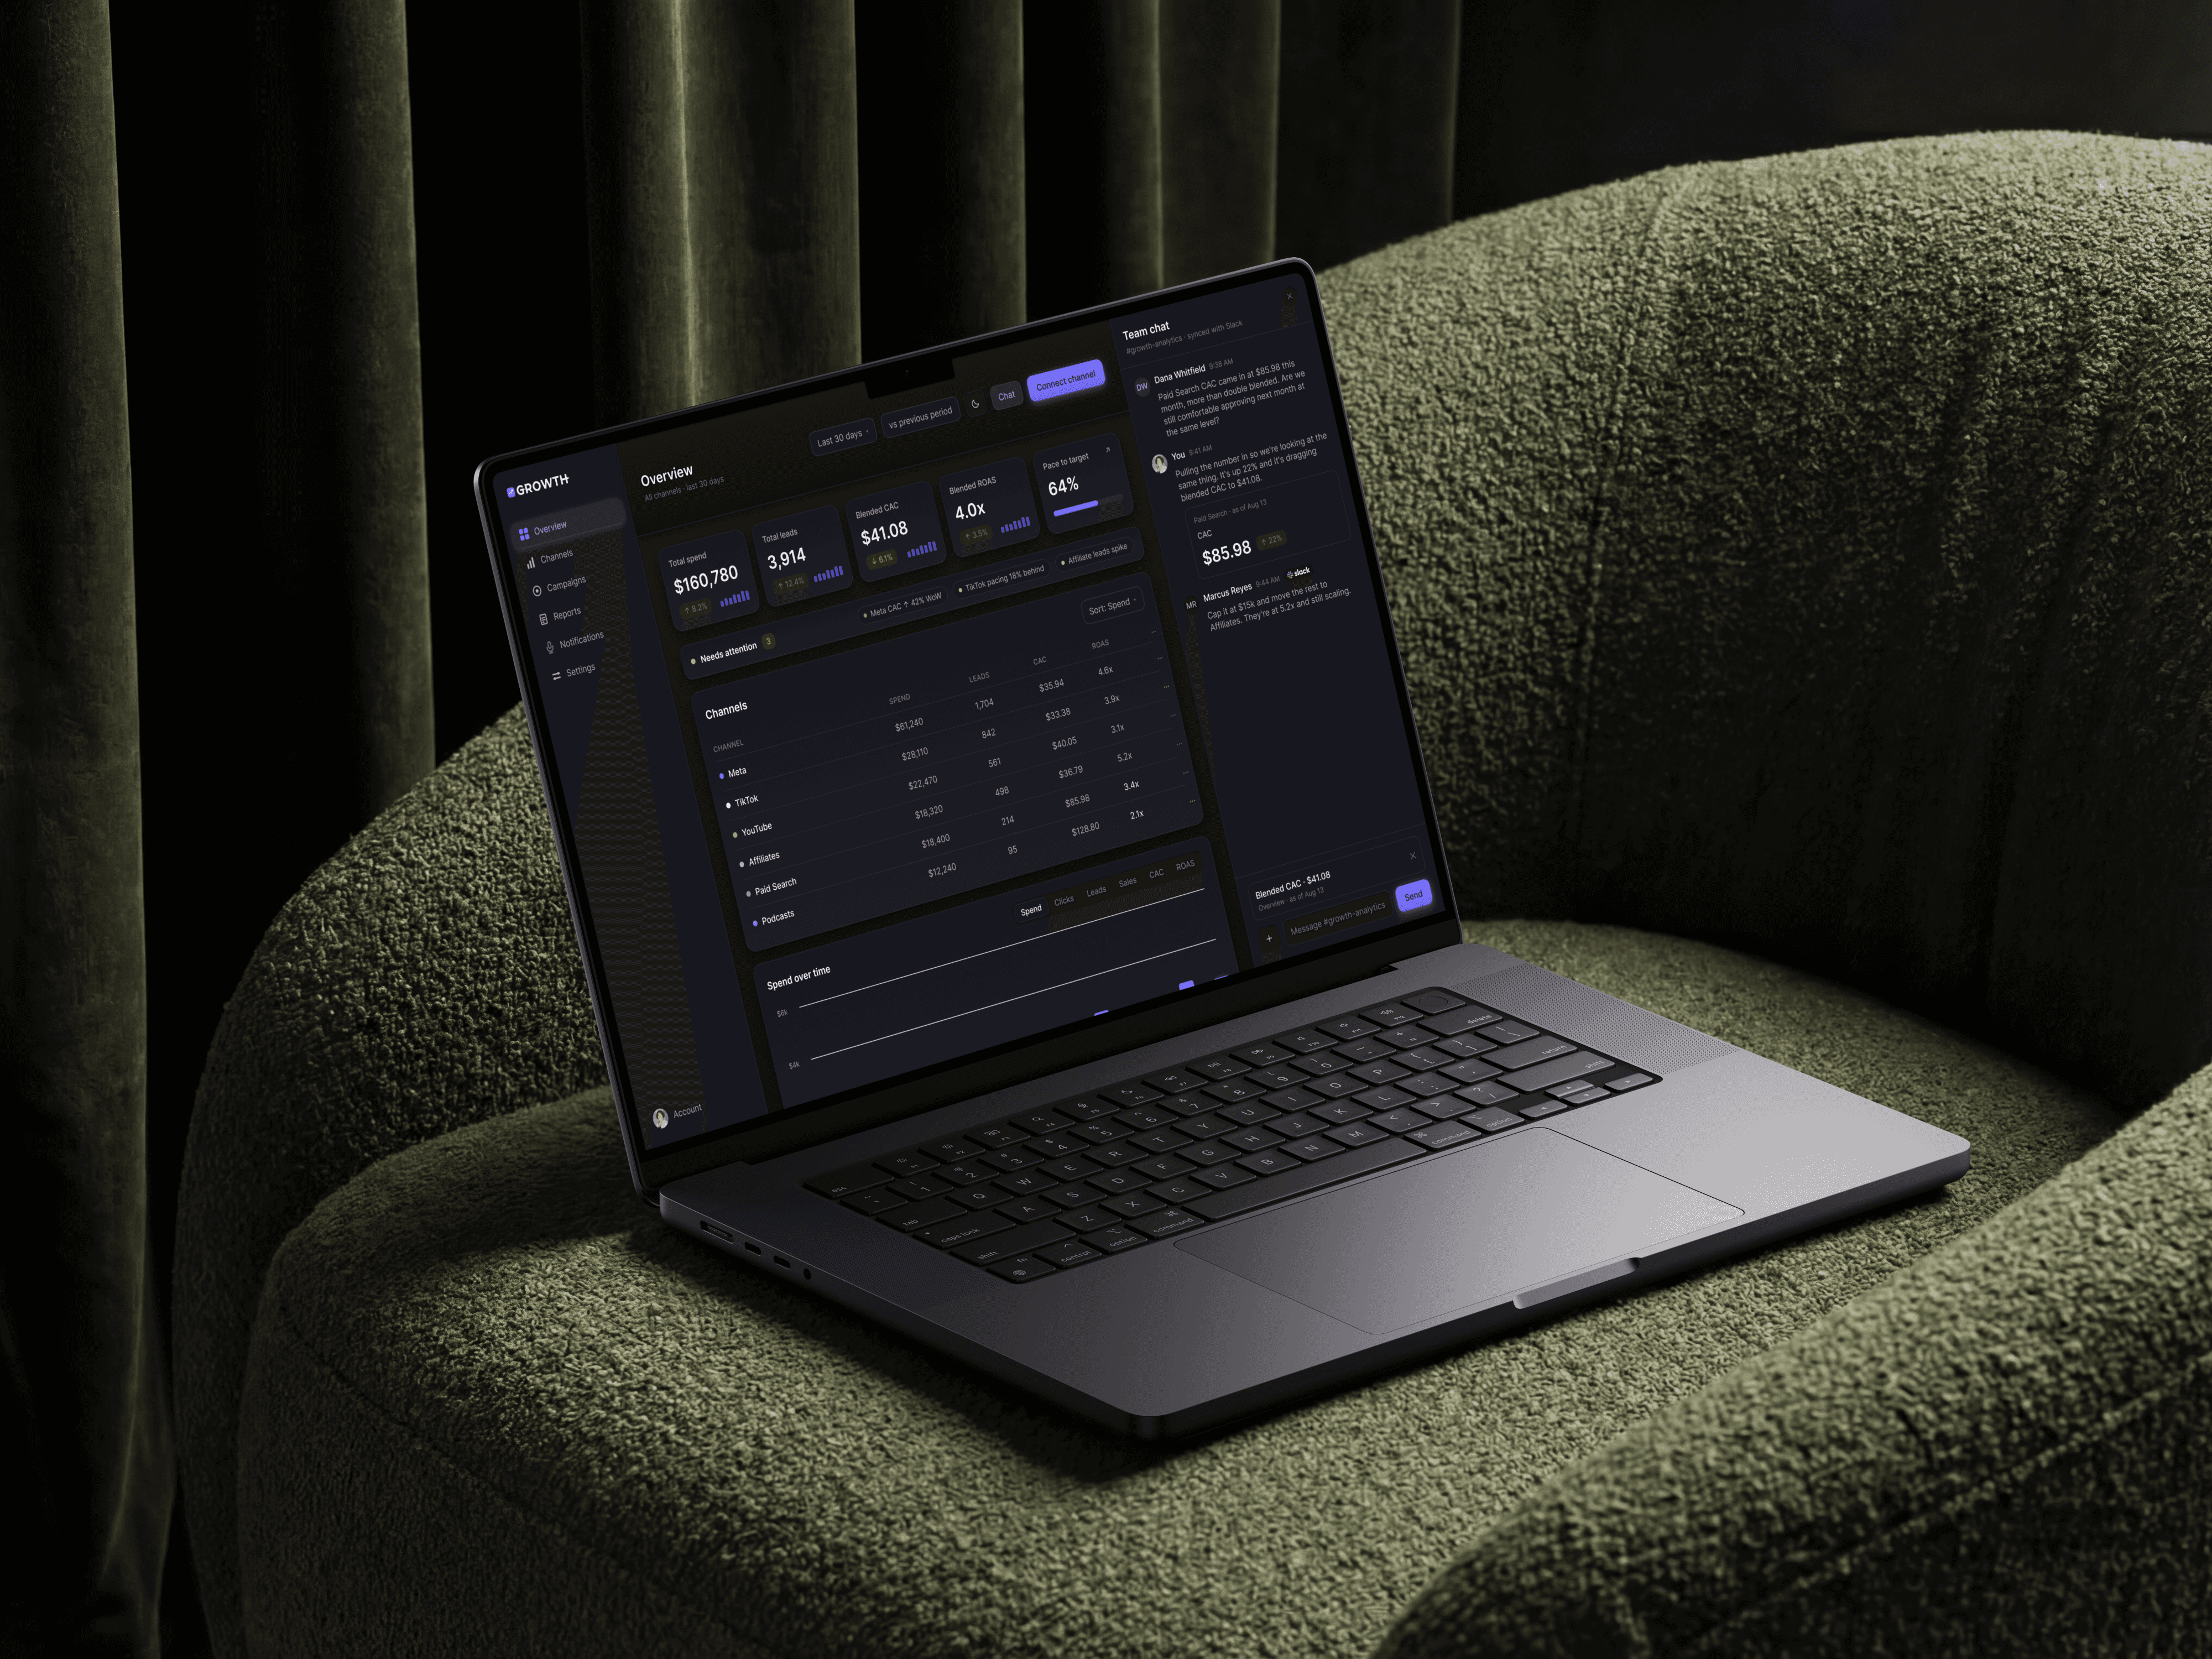
Growth is a reporting tool that shows every marketing channel in one place. My wife works in growth marketing. Her team runs six advertising channels, and every one of them lives in a different tool. Every week they export six spreadsheets and combine them by hand, then talk about what the numbers mean in a separate Notion doc. The data lives in one place and the thinking lives in another. I designed the tool that puts them together, the screens, the interaction model, and the design system underneath.

Growth is a reporting tool that shows every marketing channel in one place. My wife works in growth marketing. Her team runs six advertising channels, and every one of them lives in a different tool. Every week they export six spreadsheets and combine them by hand, then talk about what the numbers mean in a separate Notion doc. The data lives in one place and the thinking lives in another. I designed the tool that puts them together, the screens, the interaction model, and the design system underneath.

Growth is a reporting tool that shows every marketing channel in one place. My wife works in growth marketing. Her team runs six advertising channels, and every one of them lives in a different tool. Every week they export six spreadsheets and combine them by hand, then talk about what the numbers mean in a separate Notion doc. The data lives in one place and the thinking lives in another. I designed the tool that puts them together, the screens, the interaction model, and the design system underneath.

Role:

Product Designer

Product Designer

Year:

2026

2026

  • Explore the full story –

Challenge

Every channel counts success differently. Meta counts one way. TikTok counts another. YouTube counts views. Affiliates count last click. Podcasts barely count at all. You cannot just add them together and get a real answer. But that is what a weekly spreadsheet does, and by the time it is finished, it describes a week that is already over. The obvious solution is to blend everything into one score. It looks clean, and it hides the disagreement between the channels, which is the part the team actually needs to see. A marketer who trusts that number makes worse decisions than one who does not have it.

Objective

Show every channel at once, without visually showing they measure the same thing. Each channel owns a colour, with its name always beside it The measurement rule sits next to the number, "Meta: last touch, 7-day click". The conversation sits next to the data, attach a number to a message and it keeps its source. A missing number shows a dash, never a zero, a zero looks measured

Results

Never built, so no invented metrics. What the design changes: The weekly spreadsheet goes away, the team sees today, not last week, a new channel doesn't need a redesign. Underneath: a three-tier token system where every channel is encoded as a token,so a channel's identity is defined once and used everywhere, and adding a seventh doesn't mean redesigning anything.